Powerhouse Blueprint Testing by EARL and SuperCATS
Date Posted:
September 22, 2012
Category:
Blueprint Case Studies
Ebonite International Product Development Engineer Jason Kosby recently had the
opportunity to perform some on-lane ball motion testing at USBC's International
Training and Research Center in Arlington, Texas. The goal was to use the
facility's Enhanced Automatic Robotic Launcher (EARL) and computerized ball
tracking system (SuperCATS) to test Powerhouse Blueprint's accuracy when varying
bowler delivery parameters.
With the help of USBC's Jason Milligan and the rest of USBC's Equipment
Specifications team, four separate tests were conducted, with each test isolating one of the four
critical bowler delivery parameters of ball speed, rev rate, axis rotation
angle, and axis tilt angle. The results are summarized below.
Ball Speed Test
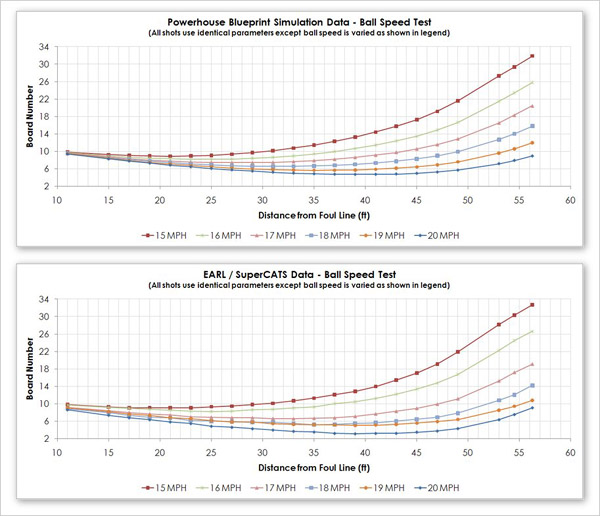
For this test, six shots were thrown with everything identical for each delivery
except ball speed. The first shot started with a 15 MPH launch speed and
each subsequent shot's speed was increased by 1 MPH, all the way up to 20 MPH.
The image below shows both the Powerhouse Blueprint prediction and the actual
on-lane motion as captured by the SuperCATS system:

Examining the above graphs, we can see that Blueprint did a pretty phenomenal job
at predicting the change in on-lane motion for different ball speeds.
Looking at the extreme cases of 15 MPH and 20 MPH, Blueprint predicted a change
in position at the last sensor location of 23.0 boards, while the actual change
as recorded by SuperCATS was 23.6 boards.
Rev Rate Test
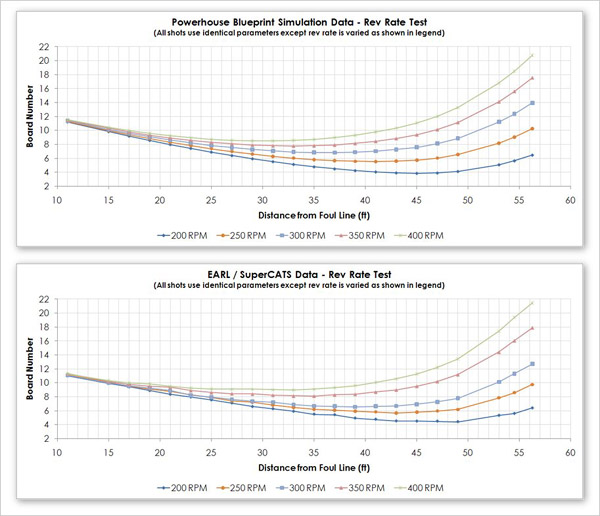
We next performed a very similar test as that
which was shown above for ball speed, but this time we varied the launch rev
rate. This time, five shots were simulated and thrown, starting with 200
RPM and ending with 400 RPM:

Again, the results here were very good. Looking again at the extreme cases,
Blueprint predicted a spread of 14.3 boards at the last sensor, while SuperCATS
recorded the actual spread as 15.0 boards.
Axis Rotation Angle Test
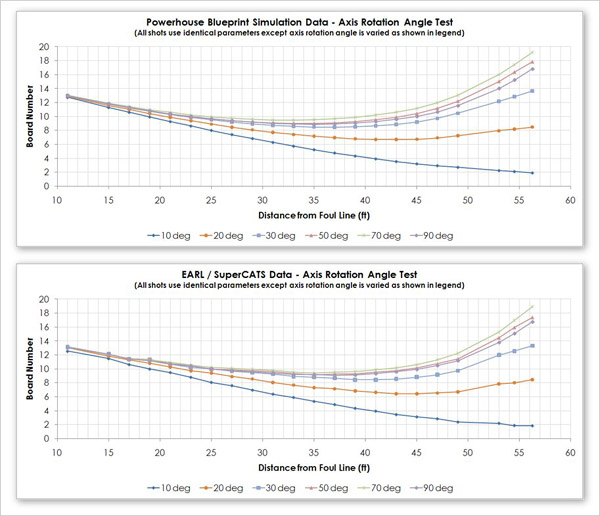
For the axis rotation angle test, we simulated and threw six shots, with axis
rotation values of 10 degrees, 20 degrees, 30 degrees, 50 degrees, 70 degrees,
and 90 degrees:

If you examine the Blueprint graph closely, you will see that overall hook
increases all the way up to 70 degrees of axis rotation, but then drops
significantly for the 90 degree case (its total hook is actually less than the
50 degree case). While this may seem somewhat counterintuitive, this exact
result was duplicated by EARL and SuperCATS! And, when we again look at
the overall magnitude of the spread at the last sensor location, we see that
Blueprint predicted a spread of 17.3 boards while SuperCATS recorded a spread of
17.1 boards.
Axis Tilt Test
For our final test, we decided to complicate things slightly to not only show
that Blueprint correctly handles axis tilt, but to also demonstrate a
little-known relationship between axis tilt and rev rate that has the potential
to greatly simplify the mystery of ball motion for bowlers and ball drillers.
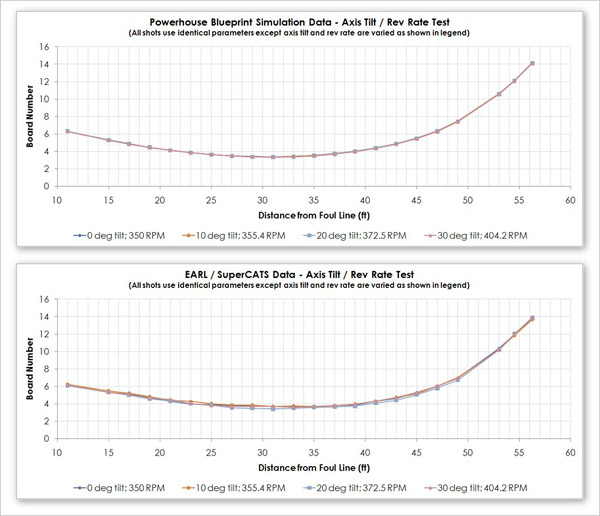
In this test, we simulated and threw four shots which varied both axis tilt
angle and rev rate simultaneously such that all four shots had equal "effective
rev rate", where effective rev rate is defined and computed as follows:
Effective Rev Rate = Rev Rate x cosine(Axis Tilt Angle)
So what is the significance of effective rev rate? Let's look at the
simulated and actual on-lane results and then the significance will probably be
pretty obvious:

As you can likely see, all four shots had identical on-lane motion! This
shows that, as far as on-lane motion is concerned, axis
tilt angle and rev rate really shouldn't be thought of as two independent
parameters. Instead, they can be combined into one parameter called
effective rev rate and all combinations of axis tilt angle and rev rate that
result in equal effective rev rate will react identically!
Closing Comments
We feel that the above data definitively proves Powerhouse Blueprint's accuracy
with respect to simulating different bowler styles. However, there are a
couple of caveats worth mentioning so that nothing presented here is taken out
of context.
Testing Environment
It is important to remember that this set of tests was performed in an extremely
controlled environment. Since the goal of the test was to specifically test
bowler delivery parameter variation, all other factors and possible sources of
inaccuracy were controlled as much as possible. Specifically,
here are some of the additional details of the tests:
- The same bowling ball was used for all deliveries. The bowling ball used was an
Ebonite International test ball with a low RG / high differential asymmetrical
core and a medium aggressive hybrid coverstock. The ball was drilled with
an 80 x 5.75 x 40 layout.
- The Blueprint coverstock data for the test ball was computed on the same lane
using the same oil pattern, oiling machine, and oil type as that which was used
for all of the tests. This eliminates any error associated with the fact
that all lane surfaces, oiling machines, and oil types are slightly different.
- Except as noted above for each test, all deliveries were thrown with 17.5 MPH
ball speed, 350 RPM rev rate, 60 degrees of axis rotation angle, 10 degrees of
axis tilt angle, and a PAP of 5" right and 3/8" up.
What does all of this mean? It means that in the real world, it is unlikely
that Blueprint's on-lane motion predictions are going to be exactly identical to
the actual on-lane motion observed when the ball is physically thrown (as was
the case in these tests). This is because you will be throwing your shots
on a lane surface that is slightly different, which was oiled by a machine that
is slightly different, than the conditions on which the ball was originally
tested. All bowling ball data included with Powerhouse Blueprint is
calibrated to the lanes and oil machine at Ebonite's testing center in
Hopkinsville, Kentucky. What this means is that, while the absolute amount
of hook you see may vary slightly from what Blueprint shows, the relative
differences you see between different balls and bowlers in Blueprint will hold
true in the real world.
Limitations of Effective Rev Rate
Above, it was stated that, all other things equal, all shots thrown with equal
effective rev rates will have identical on-lane motion. While this is
almost completely true, there is one small caveat in that shots thrown with a
bowling ball that has significant static imbalance will react slightly
differently depending on the amount of axis tilt, even if effective rev rates
are the same. In practice, this effect is extremely minor. We
mention it here only for the sake of completeness (and not because it is a
significant factor). It should be noted, however, that the ball used in
the above effective rev rate test was drilled such that it had absolutely no
static imbalance in order to completely eliminate this factor.
Also, please remember that the concept of equivalent effective rev rates
producing equivalent on-lane motion does not extend to discussions on pin carry.
Many bowlers believe that, all other things equal, higher axis tilt results in
better pin carry. This may well still be true, but quantifying the pin
carry effects of axis tilt was not part of this study.
Acknowledgements
Special thanks to Jason Milligan and the rest of the USBC's Equipment
Specifications team for their support of this study. The USBC's
International Training and Research Center is an ideal facility for a study of
this type and we are grateful for having the opportunity to use it.
Also, special thanks to Jason Kosby and the rest of the Ebonite International
team for executing these tests and post-processing the results. Ebonite's
Research and Development team is the best in the business and their willingness
to push the limits of bowling ball motion simulation is really leading to some
great knowledge and insight into ball dynamics and on-lane motion.