Below are some screenshots of the Powerhouse Blueprint software. They show the various input screens, where you can
enter your information and virtually drill the ball; the simulation screens, where you can simulate the motion of the
ball on the lane; and a few other images that highlight some of the software's features. Click on any of the thumbnails
below to view the full-size images in a slideshow.
-
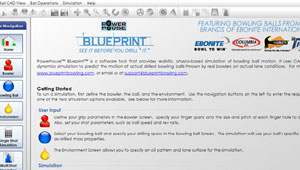
Home Screen
Blueprint's Home Screen provides an overview of the software and gives some basic tips to help you get up and running as quickly as possible.
-
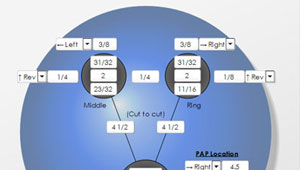
Bowler Grip Screen
The Bowler Grip Screen allows you to input everything that describes a bowler's grip, such as hole sizes, spans, pitches, etc.
-
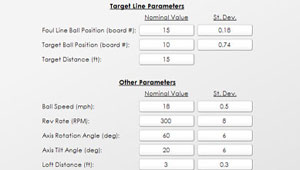
Bowler Delivery Screen
The Bowler Delivery Screen allows you to input the parameters that describe a bowler's delivery, such as ball speed, rev rate, axis rotation, etc.
-
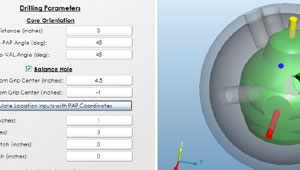
Bowling Ball Screen
On the Bowling Ball Screen, you see a 3D model of the actual ball. Here, you can virtually drill the ball, experiment with weight holes, and see how the ball's mass properties change.
-
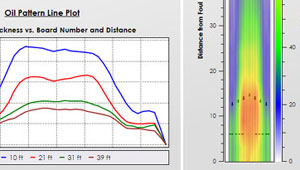
Environment Screen
The Environment Screen lets you specify an oil pattern and lane surface. Select from a wide variety of oil patterns from
Kegel and the PBA and then select the appropriate wood or synthetic lane surface.
-
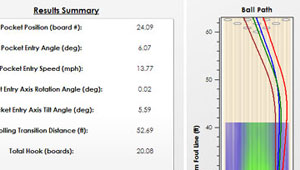
Single Shot Simulation Screen
After you have supplied all of the required inputs, you're ready to simulate how your ball will perform on the lane. You can even plot multiple shots, to see the effect of adjusting your input parameters.
-
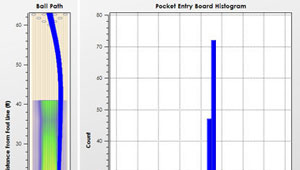
Multi Shot Simulation Screen
A Multi Shot Simulation simulates hundreds of shots using the natural variation in your delivery.
-
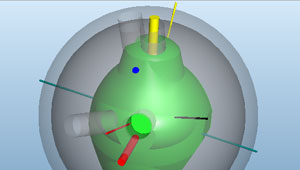
As-Drilled RG Axes
When you drill the ball, you change its mass properties. On the Bowling Ball screen, you can see the effect of drilling on the principal RG axes.
-
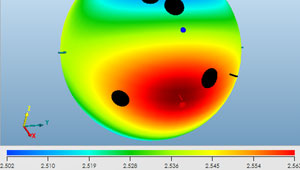
RG Contour Plot
On the Bowling Ball screen, view the RG contours of the ball both before and after drilling. RG contours are useful in predicting axis migration.
-
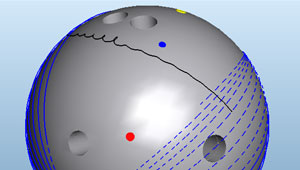
Ball Track Plot
View the predicted ball track overlaid on the drilled ball. Verify before you drill that the ball won't roll over any holes!
-
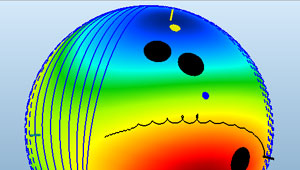
Ball Track With RG Contour Overlay
With the RG contour plot overlaid onto the ball track plot, you can see that the axis migration follows a line of near-constant RG.
-
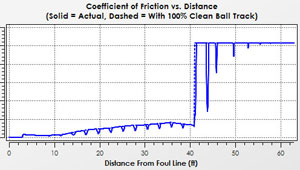
Coefficient of Friction Plot
See the friction between the ball and lane during the shot - you can even see the friction drop when the ball rolls over the track bowtie!
-
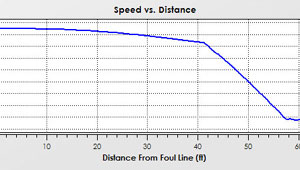
Ball Speed Plot
Shows the ball speed as the ball travels down the lane.
-
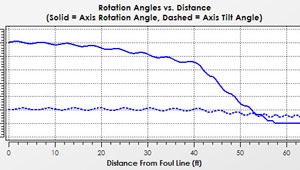
Rotation Angles Plot
Shows axis rotation angle and axis tilt angle as the ball travels down the lane.
-
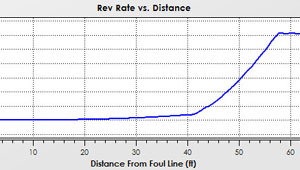
Rev Rate Plot
Shows the rev rate as the ball travels down the lane.